Debt Payoff Calculator for San Jose, CA: A Real Debt Freedom Simulation
A San Jose-specific debt payoff example using real local income and living-cost data, with a realistic payoff simulation, structured local tables, animated SVG charts, and a starter scenario for Debt Freedom Planner.
A San Jose-specific debt payoff example using real local income and living-cost data, with a realistic payoff simulation, structured local tables, animated SVG charts, and a starter scenario you can take into Debt Freedom Planner.
Debt Payoff Calculator for San Jose, CA: A Real Debt Freedom Simulation
San Jose is the next pending city in the DebtFreedomPlan.net city queue, and it is one of the clearest examples of why a debt payoff calculator needs local numbers. San Jose households often have very strong incomes on paper, but housing and baseline living costs are high enough to erase margin fast.
If you live in San Jose, California and earn around the local median household income of $146,427, the real question is not whether debt payoff is theoretically possible. It is how much room is left after a believable South Bay baseline and whether that room can be held long enough to kill high-interest debt.
San Jose household snapshot
| Metric | San Jose estimate | Why it matters for debt payoff |
|---|---|---|
| Median household income | $146,427/year | Useful anchor for a city-specific payoff example. |
| Average rent | $2,900/month | Local rent pressure is one of the biggest reasons San Jose debt plans look easier on paper than they feel in real life. |
| Median property value | $1,230,000 | Home costs in San Jose are high enough that housing decisions dominate debt-payoff margin. |
| Homeownership rate | 55.8% | Both renters and owners need a plan that survives a very expensive housing market. |
| Average commute time | 27.3 minutes | Transportation is not the biggest line item, but two-car households can still bleed away payoff cash flow. |
| Metro unemployment rate | 4.3% | Helpful reality check on current labor-market conditions for the San Jose metro. |
| Required annual income before taxes for a 1-adult living-wage budget | $78,903 | Shows the local no-frills income floor before aggressive debt payoff begins. |
In plain English: San Jose can support fast debt payoff, but only if a household protects margin on purpose. Strong income does not help much when housing, transportation, and basic lifestyle costs absorb most of the raise before the debt plan ever starts.
A real San Jose debt payoff simulation
For this San Jose example, assume a household earns the city median income, brings home about $9,553/month after taxes as a planning estimate, and uses MIT Living Wage categories for a no-frills San Jose-Sunnyvale-Santa Clara baseline budget.
| Category | Monthly estimate |
|---|---|
| Housing | $2,620 |
| Food | $420 |
| Transportation | $907 |
| Medical | $305 |
| Civic / misc. essentials | $323 |
| Internet & mobile | $156 |
| Other basics | $416 |
| Total essentials | $5,147/mo |
That leaves roughly $4,406/month before discretionary spending. To keep the scenario believable, this San Jose plan commits $2,500/month to debt and leaves about $1,906/month for irregular costs, family expenses, utilities, repairs, subscriptions, and the stuff that usually blows up fragile payoff plans.
Debt balances used in the San Jose simulation
| Debt | Balance | APR | Minimum payment |
|---|---|---|---|
| Credit Card A | $14,800 | 24.99% | $370 |
| Credit Card B | $9,300 | 21.49% | $235 |
| Auto Loan | $16,400 | 6.99% | $342 |
| Personal Loan | $7,200 | 11.99% | $176 |
| Total | $47,700 | — | $1,123 |
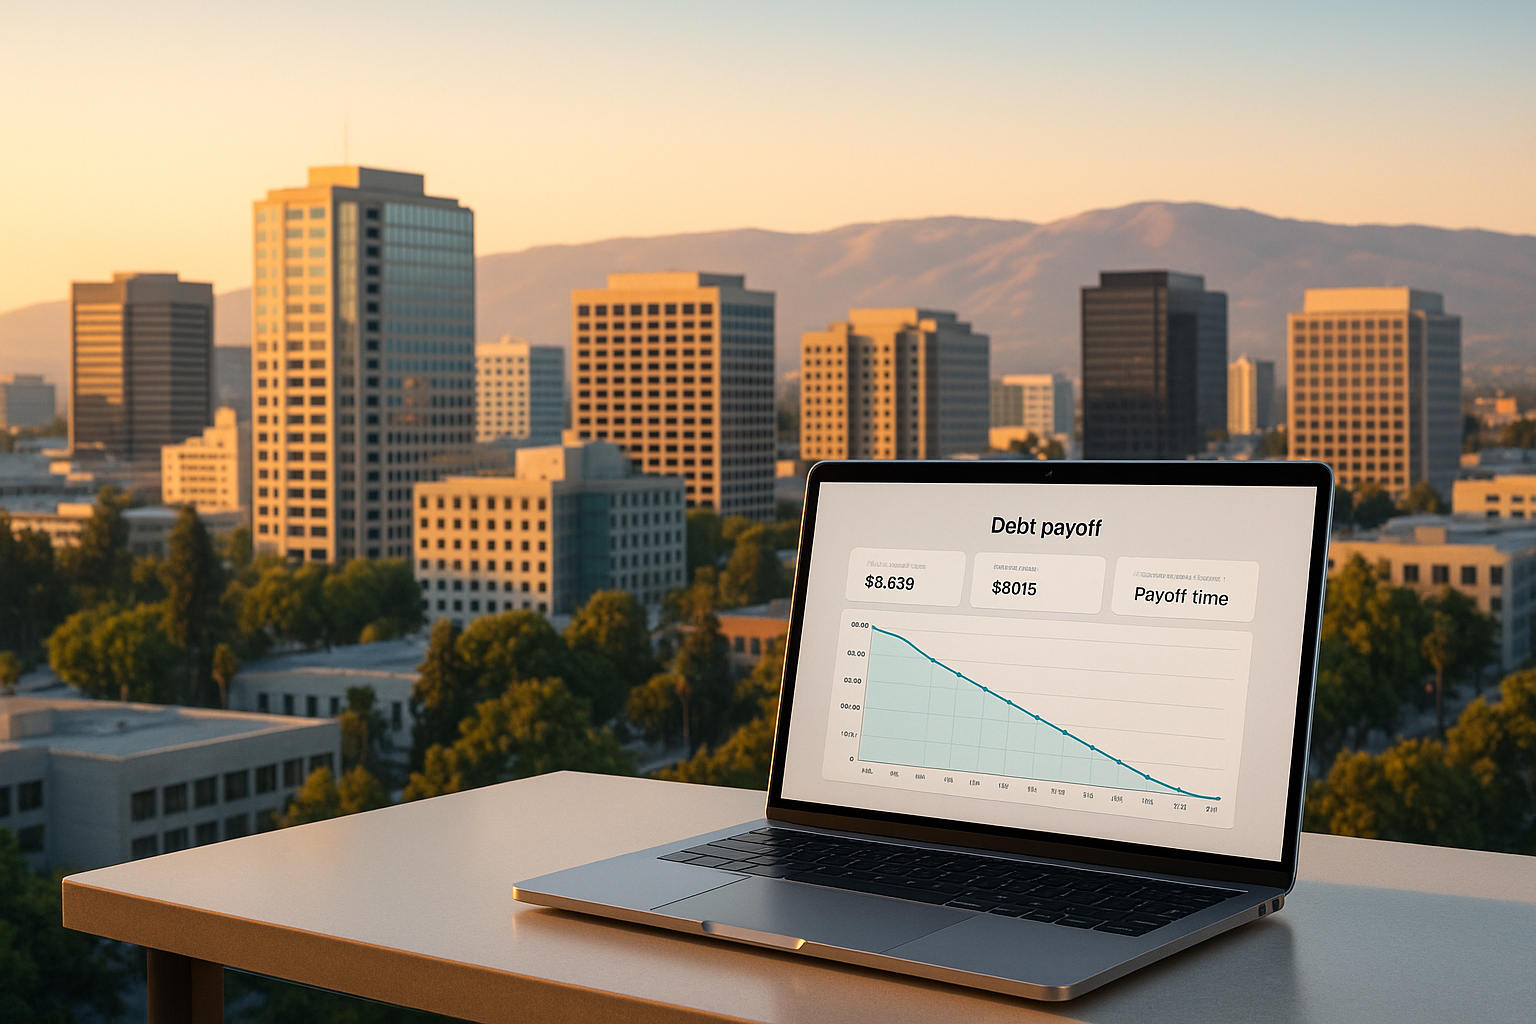
San Jose payoff result: what happens at $2,500/month?
Using a debt avalanche strategy, this San Jose example pays off $47,700 in about 22 months — roughly 1 year and 10 months — with about $6,224 in total interest.
If the same household paid only the combined minimums of about $1,123/month, the payoff stretches to about 67 months with about $27,199 in interest.
That means the more focused San Jose plan finishes about 45 months sooner and avoids about $20,975 in interest.
San Jose payoff timeline snapshot
| Milestone | Approximate timing | Estimated remaining balance |
|---|---|---|
| Start | Month 0 | $47,700 |
| After 12 months | Year 1 | $23,043 |
| After 18 months | Year 1.5 | $8,805 |
| Debt-free point | Month 22 | $0 |
This is a model, not a promise. Real results move around with statement dates, minimum-payment formulas, teaser APRs, fees, and whether new balances get added. The point of the simulation is not perfect prediction. It is showing what a realistic San Jose debt plan can look like before you customize it.
If you live in San Jose earning around the median income
- High income does not equal low stress. San Jose can pay well and still leave households cash-flow tight because housing takes such a huge bite.
- Housing is the dominant lever. Rent, insurance, HOA, or mortgage changes can move the debt-free date more than small category cuts.
- A fixed debt target beats leftovers. A planned $2,500/month attack is far more useful than waiting to see what is left at month-end.
- Job volatility still matters. Even with a relatively low metro unemployment rate, tech-heavy income can be lumpy enough that a buffer matters.
Load this San Jose starter scenario into Debt Freedom Planner
The best next move is not another generic debt article. It is plugging your own balances, due dates, and real San Jose spending into Debt Freedom Planner so you can pressure-test the plan against local costs.
Starter scenario includes: local budget categories, the four debts above, a $2,500/month total payment, and avalanche as the first strategy to test.
{
  "city": "San Jose, CA",
  "grossIncomeAnnual": 146427,
  "takeHomeMonthly": 9553,
  "monthlyCosts": {
    "housing": 2620,
    "food": 420,
    "transportation": 907,
    "medical": 305,
    "civic": 323,
    "internetMobile": 156,
    "otherBasics": 416
  },
  "debts": [
    {
      "name": "Credit Card A",
      "balance": 14800.0,
      "apr": 24.99,
      "minimum": 370.0
    },
    {
      "name": "Credit Card B",
      "balance": 9300.0,
      "apr": 21.49,
      "minimum": 235.0
    },
    {
      "name": "Auto Loan",
      "balance": 16400.0,
      "apr": 6.99,
      "minimum": 342.0
    },
    {
      "name": "Personal Loan",
      "balance": 7200.0,
      "apr": 11.99,
      "minimum": 176.0
    }
  ],
  "totalDebtPayment": 2500,
  "strategy": "avalanche"
}
Related city pages and core guides
- Debt Payoff Calculator for San Diego, CA
- Debt Payoff Calculator for Los Angeles, CA
- Debt Payoff Calculator for Phoenix, AZ
- Debt Payoff Calculator for San Antonio, TX
- Debt Snowball vs Avalanche for 3 Credit Cards
- How to Pay Off Debt When Your Income Changes Every Month
- Should You Use Savings to Pay Off Debt or Keep an Emergency Fund First?
- What to Do If Your Credit Card Minimum Payment Is More Than You Can Afford
- Main Debt Freedom Planner calculator
Bottom line for San Jose
San Jose is a great example of why debt payoff planning needs local math. The city gives a lot of households real earning power, but the cost structure is so aggressive that a plan can still fail if the margin is not protected deliberately.
If you want the exact month you could be debt-free in San Jose, plug your own balances into Debt Freedom Planner and start from this local scenario instead of guessing.
Sources
- Data USA: San Jose, CA — 2024 median household income, population, median property value, homeownership rate, and commute time.
- MIT Living Wage Calculator: San Jose-Sunnyvale-Santa Clara, CA — 2026 living wage plus annual costs for housing, food, transportation, medical, civic, internet/mobile, and other basics.
- Zillow Rental Manager: San Jose average rent — current market rent reference used for context.
- U.S. Bureau of Labor Statistics: San Jose-Sunnyvale-Santa Clara economy at a glance — January 2026 unemployment rate.
0 comments
Ask a question, add context, or share what worked for your household.
Create a free account or sign in to comment, reply, and vote on blog posts.